Monitors
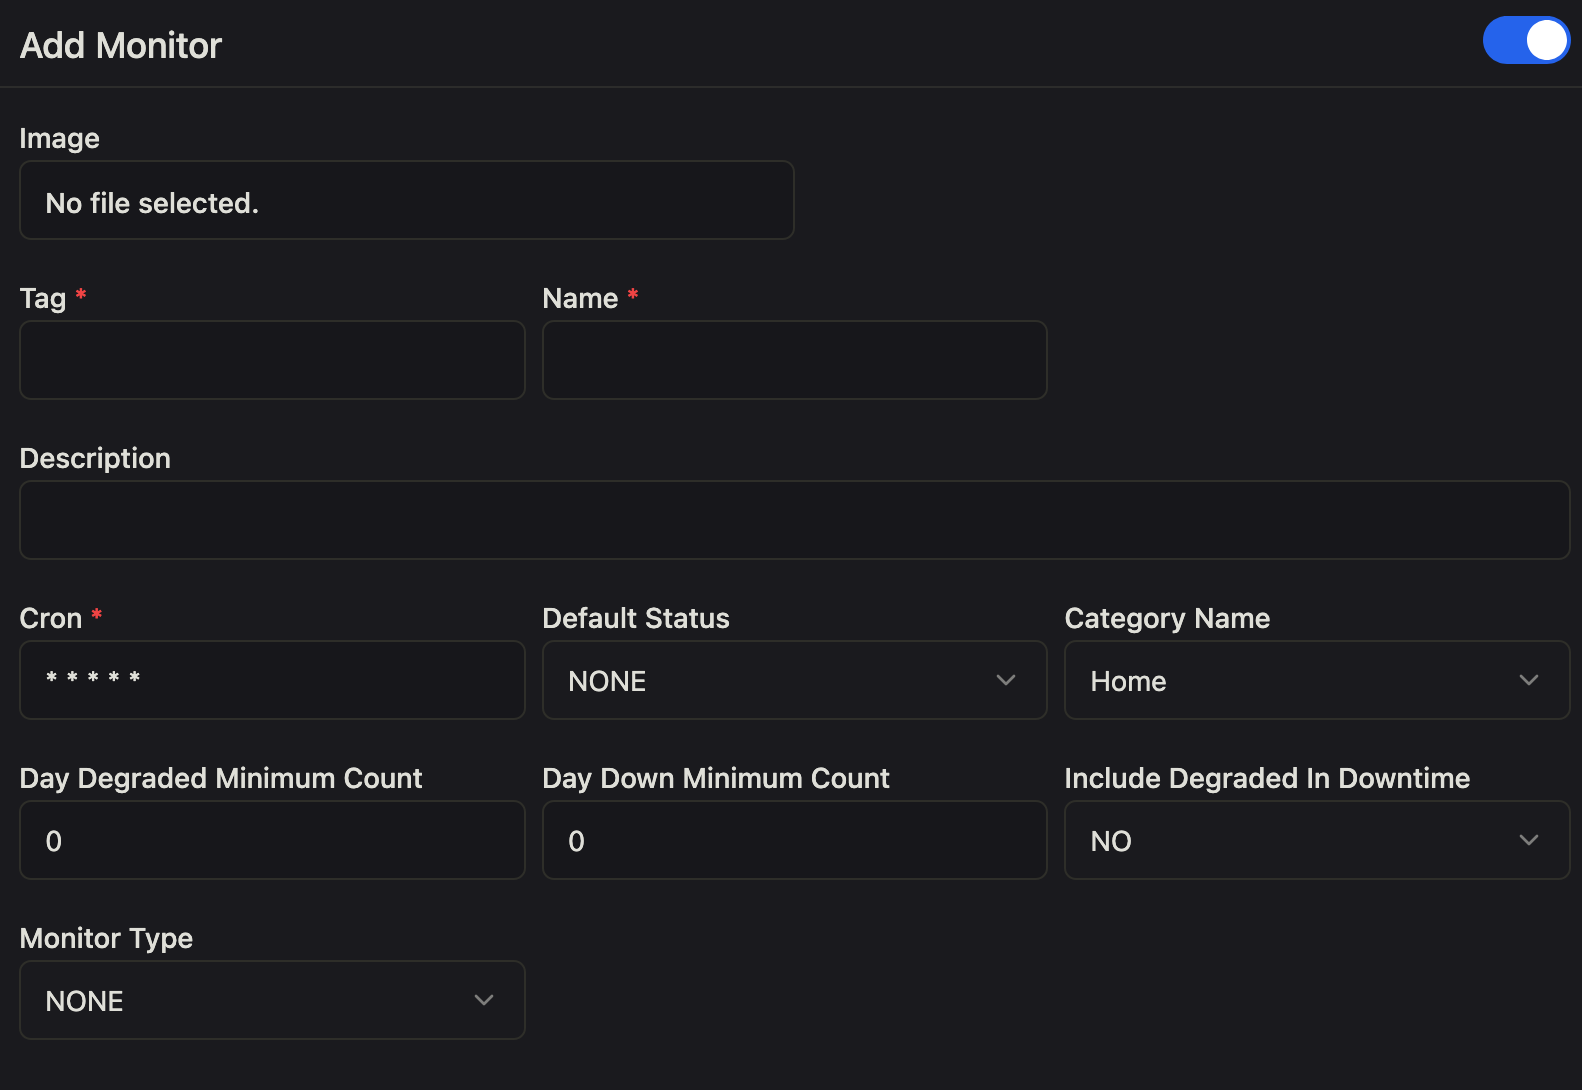
Monitors are the heart of Kener. This is where you define the monitors you want to show on your site.
Add Monitors
Click on the ➕ to add a monitor.

Tag
UNIQUE & REQUIREDThe tag is unique to each monitor and is used to identify the monitor in the code. It is also used to generate the URL for the monitor.
Name
UNIQUE & REQUIREDName is also unique to each monitor and is used to identify the monitor in the admin panel or in the status page.
Image
The image is used to display a logo or an image for the monitor. It is displayed on the status page and in the admin panel. It is optional.
Description
The description is used to describe the monitor. It is displayed on the status page and in the admin panel. It is optional. You can also write html in the description and can use tailwind classes.
Cron
REQUIREDThe cron is used to define the interval at which the monitor should run. It is a cron expression. For example, * * * * * will run the monitor every minute.
Default Status
Using default status you can set a predefined status for the monitor. The predefined status can be UP, DOWN, or DEGRADED. If the monitor does not have api/dns/ping or if the monitor status is not updated using webbhook, manual incident this will the status of the monitor.
Category Name
The category name is used to group monitors. It is displayed on the status page and in the admin panel. It is optional. By a home category is already present. Adding monitor to the home category will show the monitor on the home page.
Day Degraded Min Count
REQUIREDThe day degraded minimum count is used to define the minimum number of degraded incidents in a day to mark the monitor as degraded for the day. A degraded day means if you are using Monitor Style as FULL under Theme, the whole bar will be shown as Degraded (yellow color) . It is optional. It has to be more than equal to 1
Day Down Min Count
REQUIREDThe day down minimum count is used to define the minimum number of down incidents in a day to mark the monitor as down for the day. A down day means if you are using Monitor Style as FULL under Theme, the whole bar will be shown as Down (red color) . It is optional. It has to be more than equal to 1
Include Degraded
The include degraded is used to include the degraded checks in the total bad checks count. It is optional. By default uptime percentage is calculated as (UP+DEGRADED/UP+DEGRADED+DOWN). Setting it as YES will change the calculation to (UP/UP+DEGRADED+DOWN)
Monitor Type
REQUIREDAPI
To monitor an API, you need to provide the URL of the API and the expected status code. If the status code is not received, the monitor will be marked as down. You can read more about API monitoring here.
DNS
To monitor the DNS records, you need to provide the domain name and the record type. If the record is not found, the monitor will be marked as down. You can read more about DNS monitoring here.
PING
To monitor the ping, you need to provide the IP address or the domain name. If the ping is not successful, the monitor will be marked as down. You can read more about PING monitoring here.
GAMEDIG
To monitor game/service, you need to provide the game or service to monitor, the IP address or the domain name and the port. If the query is not successful, the monitor will be marked as down. You can read more about GAMEDIG monitoring here.
Triggers
To add a trigger to a monitor make sure you have created a trigger. You can read more about triggers here.
- Click on the 🔔 icon on the top right corner of the monitor.
- Add details for either DOWN or DEGRADED.
- Failure Threshold(Required): The number of consecutive failures before the trigger is activated.
- Success Threshold(Required): The number of consecutive successes before the trigger is deactivated.
- Create Incident: Chose whether to create an incident or not when the trigger is activated. The incident will be created in Github. So make sure you have set up the Github token in the environment variables. The incident will be closed when the monitor is back to UP.
- Severity (Required): The severity of the incident. It can be
CritcalorWarning. - Custom Message (Required): Add your owner alert message.
- Choose Triggers: Choose the triggers you want to activate the trigger. You can choose multiple triggers.
- It will take upto 1 minute for the trigger to be activated.
Edit Monitors
Click on the ⚙️ to edit the monitor.
Deactivate Monitor
You can deactivate the monitor by switching the toggle to off. Deactivation a monitor will stop the monitor from running. It will take one minute to deactivate.
Activate Monitor
You can activate the monitor by switching the toggle to on. Activation a monitor will start the monitor. It will take one minute to activate.
Any changes in the a live monitor will take 2 minutes to reflect.